I have been interested in using RRDtool to monitor some numeric data for a while now. The main reason is because the graphs which are created by RRDTool look quite good: They are simple, but convey useful information succinctly. I have seen them around in a few places. They look like this:
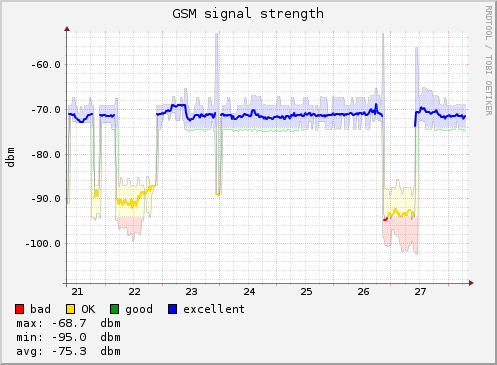
source: GSM Signal Strength
Today, I spent about 40 minutes downloading the NIFTY 50 historical data for the year 2025,
transforming it into a format that can be used to executed rrdtool update commands, and eventually
come up with a Nifty 50 12 month graph, with 12 monthly averages. That may be useful, if I want to
calculate the value of my portfolio over time. (This is also something that GnuCash sort-of does
already, though I don’t understand “Value-over-time” graphs.)
These kind of graphs would be useful for timings of various requests that are being performed on the network, or for other kinds of data (like packet counters). I was looking at USB temperature sensors, which might be an interesting project. I don’t know if will work well with Linux though. This kind of data would also just be interesting to look at over a long period of time. For instance, the number of packets sent/received by a router over a period of 10 years would be cool to see.
I saw a YouTube video where the sensor was plugged into an Android device, a Notes app was opened, and once a button was pressed on the sensor, it started acting like a keyboard and sending data to the Android device as text (pretending to be a USB keyboard, I presume).